
A supplier hierarchy you can't draw in advance
Role: Lead UX/UI Architect on the contract; in practice an experienced IC under a Design Lead, owning the most complex parts of every phase. No management function. Team: about ten designers. Period: eight months. Context: Q8 Globalize - a B2B CRM platform for Kuwait Petroleum (Q8), a closed-loop oil and gas corporation: corporate clients worldwide, retail through the Q8 station network across Europe. Built at DXC Technology / Luxoft.
Overview
The supplier hierarchy of a closed-loop corporation can't be drawn in advance - it changes faster than design can describe it. So this case is about a mechanism instead of screens: a recursive multibranding system in which clients build their own structure, and the financial rails that let money cross branch and country borders. The complexity isn't simplified away - it's handed to the user as a tool.
A hierarchy you can't draw in advance
Instead of screens for a known structure, I designed a mechanism that builds the structure itself. At the MVP launch, more than fifty corporate clients used it, each unrolling its own tree four to six levels deep - with fifty to a hundred subcontractors at every step down.
The problem
Kuwait Petroleum is a closed-loop corporation: from refining to a station on a European highway. Its business runs on a network of contractors, where every large client has its own subcontractors, and those have their own.
For close to twenty-five years this network lived in Excel. Databases, accounting, the contractor hierarchy, financial flows, discount cards. That's where I collected the pain points - from the files and from the practices that had grown around them.
The complexity wasn't in the number of screens. It was that the structure can't be pinned down. In a business like this, the contractor network changes faster than design can describe it: three levels today, five in half a year, a different-looking branch in the neighbouring country. Any interface drawn for a specific hierarchy is obsolete before release.
The solution
I stopped designing the structure and started designing the mechanism that creates it.
A corporate client sets up its own space in the CRM: its users, its subcontractors. Every subcontractor gets the same right - to add its own users and its own subcontractors. And so on down, with no limit on the number of levels.
Every node of this pyramid gets a full space of its own:
- its own documentation
- its own colour system, configured to its brand
- its own discount cards, branded for itself and its clients
- its own financial flows, branches, mapping, transactions
- its own tree of subcontractors
The platform's functions are available to it within its branch - not a cut-down version but the same tool.
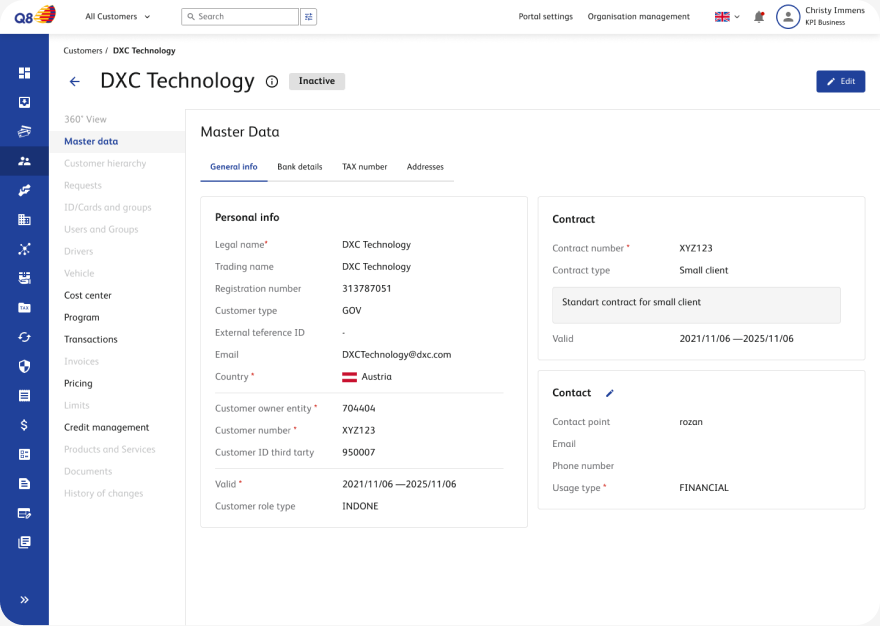
The visibility rule. A node sees the parent company one step up and its entire branch down. Sibling branches and levels more than one step up don't exist for it. One rule instead of an access-rights matrix that would otherwise have to be maintained by hand for every level.
Multibranding here isn't decoration. It is the mechanism that implements the supply chain: a branded space isn't drawn for the client - the client creates it themselves.
What it delivered
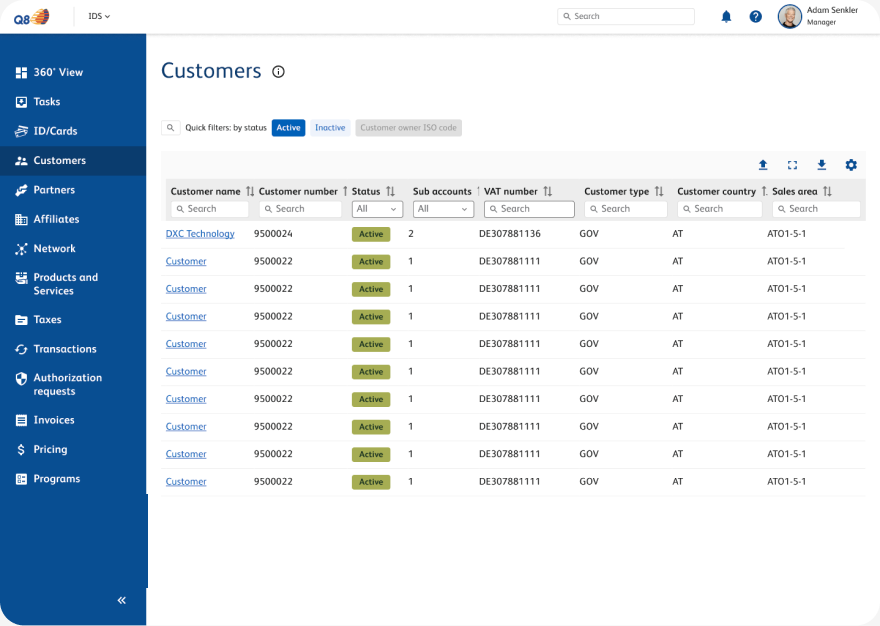
At the MVP launch, the platform was taken up by more than fifty corporate clients. Each built a separate branch four to six levels deep; the maximum nesting I counted in the live database was six.
The rollout was geometric. A first-level client has fifty to a hundred subcontractors, each of those has its own, and on down. Each branch led into its own set of countries.
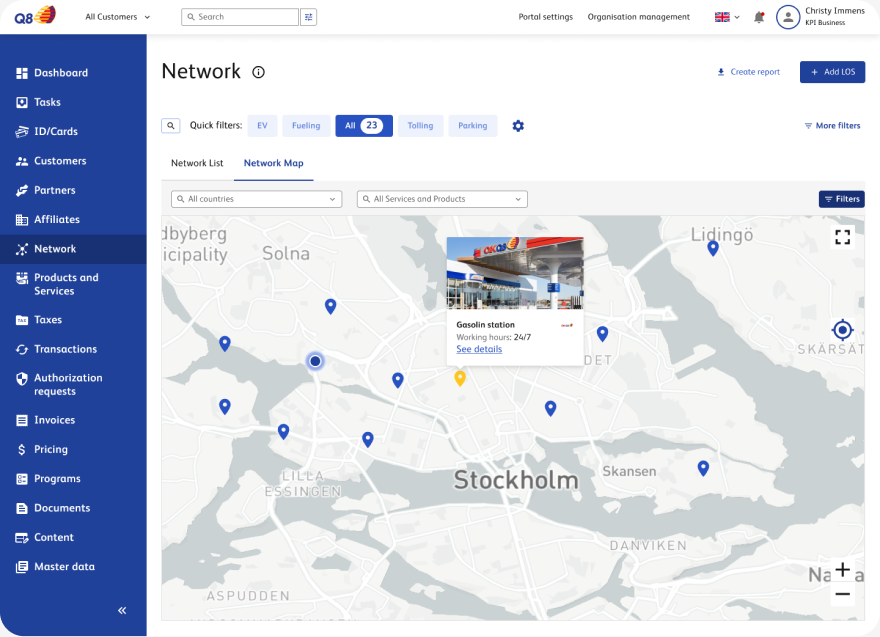
A tree five levels deep doesn't read as a list. So alongside the subcontractor list I built a second view of the same network, on a map. A client sees every level of its branch at once, and which services are active at each node. The list answers who is in the network. The map answers where it stands.
This is not a speed metric. It's evidence that the mechanism was used the way it was designed: the recursion didn't stay an architectural idea - it went to real depth, and users kept building the structure themselves, without me.
My role
I designed the mechanism: the information architecture, the structure of entities and documents, the flows and pipelines, the concepts. I did it under the guidance of a Design Lead - on this project I was an individual contributor, and I was handed the most complex parts of every phase.
Wireframes, mockups and clickable prototypes I took on partially: two more designers joined at that stage.
Money that crosses branch borders
Transactions, reconciliation, billing and invoices were mine alone - the only part of the platform where responsibility wasn't shared with anyone. The financial part was deployed first, and I saw it working on live data.
The problem
The complexity of the financial part is in ownership. Every transaction has an address in the contractor tree: whose it is, which branch it passed through, who has the right to see it. The visibility rule that defines the structure also defines which numbers are shown to whom.
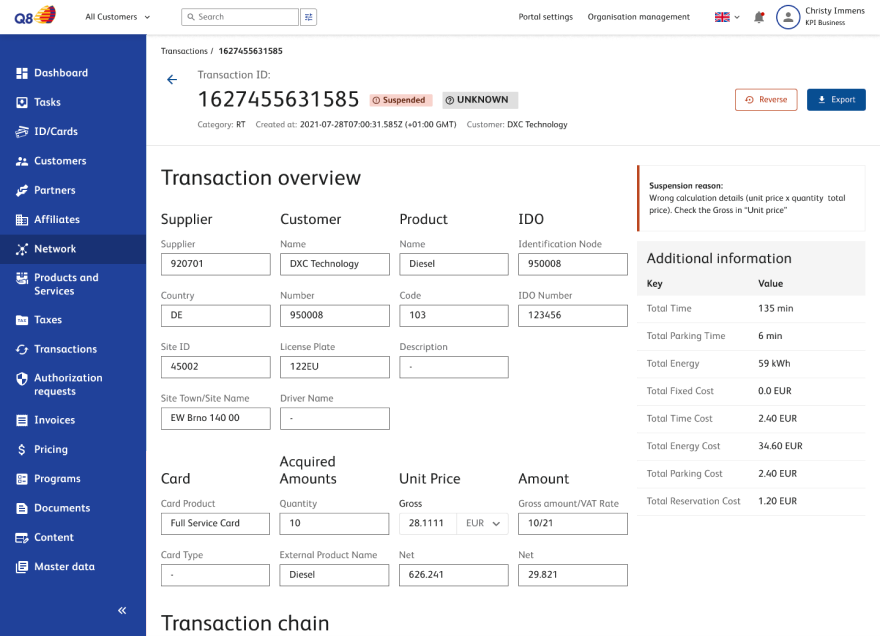
Orders in this tree flow bottom-up. A subcontractor at every level collects its subcontractors' orders and passes them one level up. The number of nodes grows geometrically, and hundreds and thousands of line items gather at the top of a branch.
The settlement for this pool has to come back down the same tree. Subcontractors on one level are tax residents of different countries: every node has to receive its amount, in its currency, at a rate taken at a clear moment - otherwise reconciliation between the levels won't add up.
And this set can't be fixed in advance: which countries, branches and currencies will gather in a run is unknown - every window collects a different combination.
The approach
I designed the settlement mechanism; the team built it.
Collection runs in windows. A window closes - and the whole pool is computed in a single pass at one timestamp. Whatever made it into the window is settled in this pool; the rest goes into the next one.
The settlement runs top-down in one pass: all branches of the pool are computed simultaneously, at one timestamp. The amount splits at every level by each node's actual volume and converts into its currency. There are as many conversions as there are sender-currency → receiver-currency pairs in the pyramid - the mechanism computes whatever combination arrived in the window. The formula of the mechanism: one timestamp, one rate per currency pair, an individual amount for every node.
Rates came from Fixer - 170 currencies, data from financial data providers and banks. The platform's settlement cycle is synced to Fixer's rate updates: sixty seconds. Fixer updates the rates - processing kicks off - invoices are formed at the moment the rate is fixed. The synchronization is deliberate: a rate change stays traceable.
All transaction flow went through a blockchain and was tracked there. It is what sits under the mechanism: traceability of the chain and rate fixation at a single timestamp. In the blockchain part, I took part.
The path every transaction repeats
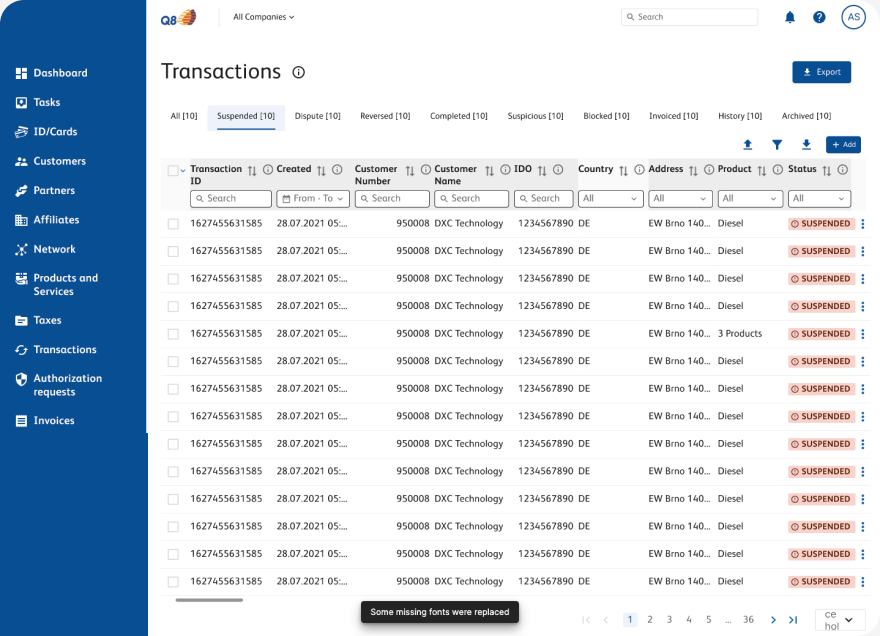
A transaction has more than two states. The client handed over a fixed pipeline, and every transaction runs it end to end, from creation to archive, with no step skipped. Everything moves through it, including the creation of discount cards and the resale of oil and gas between contractors.
The ten states in the list are that pipeline laid onto the interface as a filter: disputed, reversed, suspicious, blocked, invoiced, archived. An operator opens a state, not a pile.
I worked on this part together with two other designers.
The rest of the financial part
Large table tools, filtering and reporting - what a finance user spends the working day in. Pricing, invoicing and tax scenarios we described as journey maps, together with the team.
A dashboard the user assembles
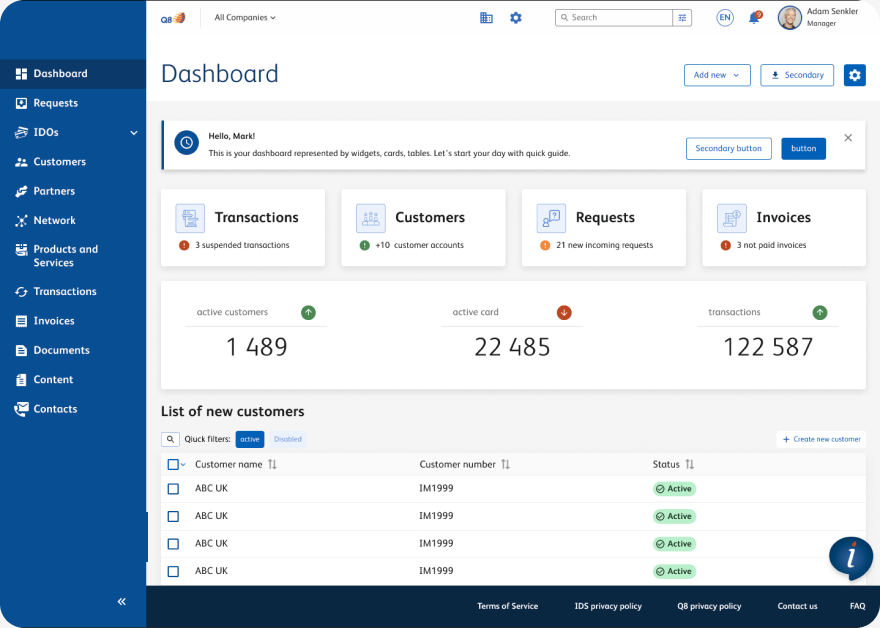
The dashboard wasn't designed as one page. The client commissioned widgets for its own specific tasks, and they added up to more than fits on a screen at once.
So the dashboard works as a kit: widgets switch on, switch off and change places, and the page stays usable in any combination. It is the same move as in the first section - instead of a fixed layout for a known set of tasks, a mechanism in which the user assembles the layout.
My part was the overall structure and some of the widgets. Several designers worked on the widget set.
How it was done
The decisions rested on research with live users and on team production. There are no confirmed research numbers - this section names the facts without them.
Research
I conducted the interviews with end users personally. I ran the stakeholder workshops myself. Usability testing took place before feature releases.
How many interviews, workshops and test participants there were - there are no confirmed numbers, and I name none.
We built twenty-four personas; the ten core ones went into the portfolio.
The design system
The Q8 design system consisted of six artifacts: Foundation, Tokens, Layouts, UI KIT, UX Patterns, Page Templates. The team split the artifacts among themselves, and every designer worked through their parts inside each artifact. I took part in building it and, together with the Design Lead, provided an additional layer of control over that distribution.
The system's authorship belongs to the team. My part is participation plus the control function.
Stack
The platform's front end was built on PrimeNG.
Result
Multibranding went into the MVP early and worked - I saw it in the live system and counted the nesting depth myself. The platform as a whole, with all its functions, I never saw in its final state, and this case doesn't call it finished.
How it was deployed
Platform functions were deployed in stages. Each was confirmed by test runs after deployment - working order was verified at every step.
Multibranding entered the MVP at the very beginning. The fifty-plus corporate clients and the branches four to six levels deep described in the first section are what I observed in that MVP myself.
The client's numbers
According to the client's analytics team, transaction time dropped by 30% and request processing time by 25%. The client did the measuring: the methodology stayed on their side, and the figures were handed to me as results.
The honesty line
My own factual base ends where my observation ends: the MVP, multibranding in operation, a live database with contractor trees. What the platform showed after all deployment phases is known to the client, not to me.